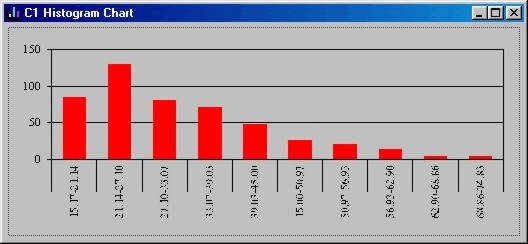
This node displays a histogram plot of the continuous data values contained within the chosen continuous column.
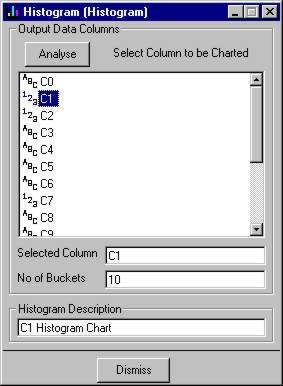
- Output Data Columns section allows you to analyse what input data columns are incomming into the node.
- Selected Column section displays the chosen column to be charted. You should choose a continuous column otherwise you will be prompted when dismissing the screen.
- No of Buckets section allows you to enter in the number of x-axis segments you wish the histogram to have. It divides the x-axis up to the number of segments you specified between the minimum and maximum value of the data for the specified column.
- Histogram Description section allows you to enter in a description of the current node. This description will be displayed in the screen header to allow you to distinguish nodes if you have several Histogram nodes displayed at the same time.
- Example Histogram View